


Spoiler: It’s Not MQLs
Let’s start with a confession:
Most demand gen reporting is smoke and mirrors.
We talk about impressions, click-through rates, MQLs, and form fills like they’re gospel.
But here’s the problem: those numbers don’t always mean business.
At Kliqwise, after running hundreds of campaigns across B2B, SaaS, and tech, we realized something:
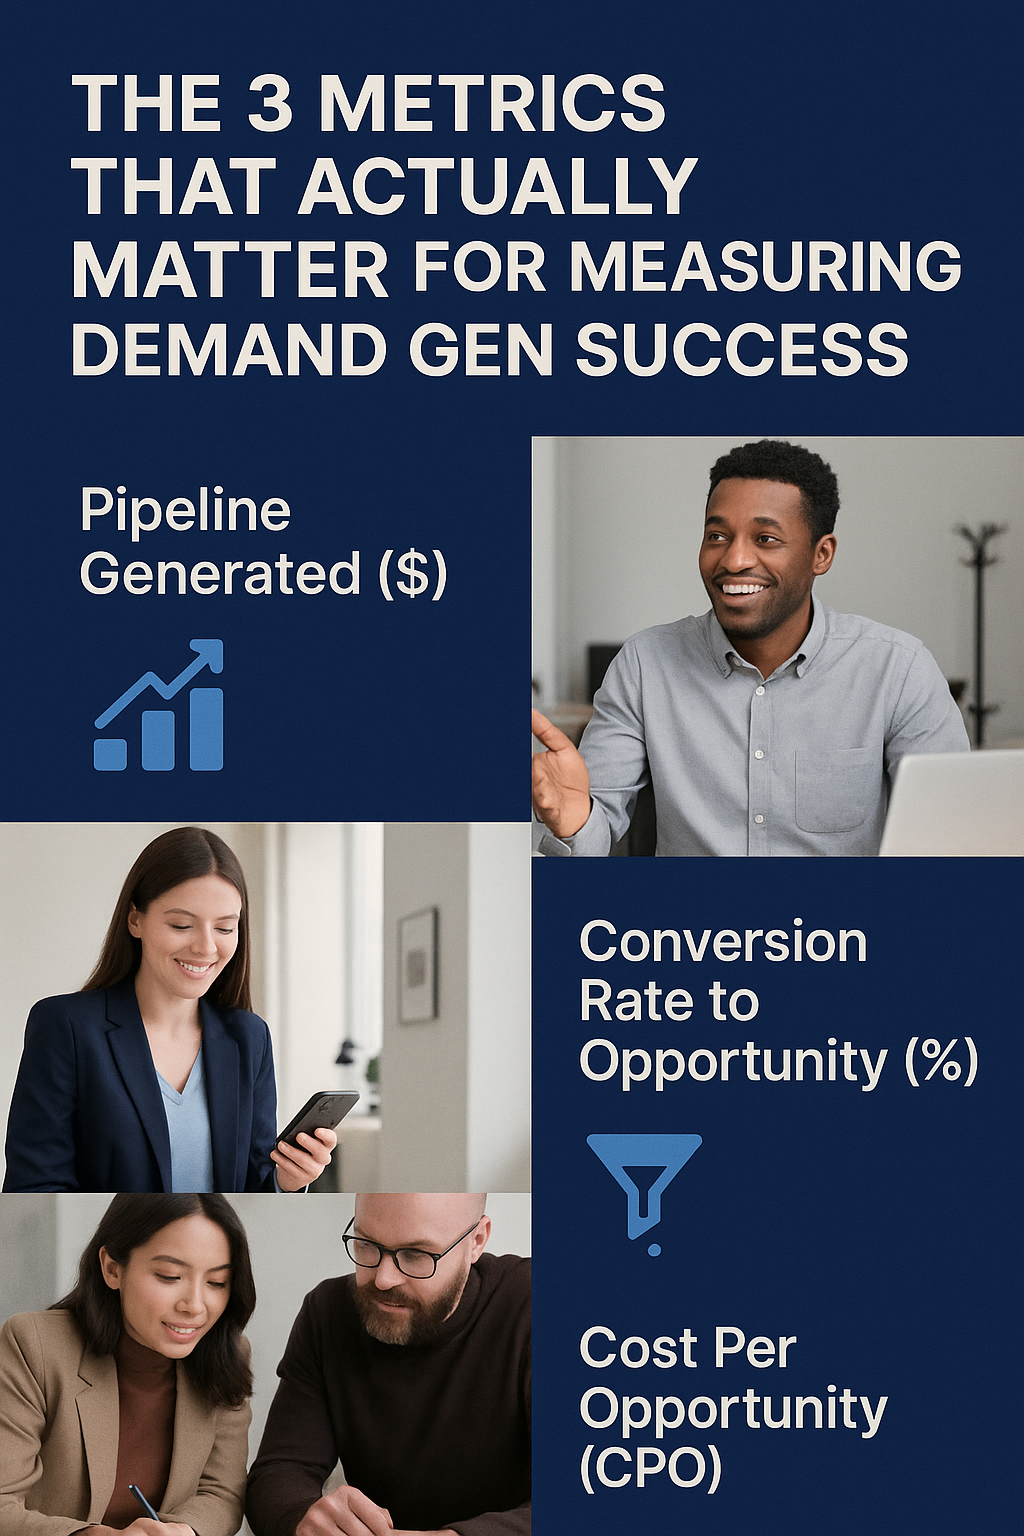
There are only three metrics that actually matter.
The rest? Vanity metrics. Nice for dashboards. Useless for boardrooms.
Let’s dive in.
1. Pipeline Generated ($)
The Real MVP of Demand Gen
If your campaigns aren’t creating real pipeline, they aren’t succeeding—period.
Pipeline Generated measures the total dollar value of opportunities directly sourced from your demand gen efforts.
Not influenced. Not touched.
Sourced.
When you start focusing here, everything else shifts:
-
You stop obsessing over MQL volume and start focusing on lead quality.
-
You align closer with sales, because both teams care about the same thing: $$$.
-
You finally tie marketing performance to business outcomes leadership cares about.
Pro Tip: Track pipeline at both a total and campaign-specific level to understand what’s actually working.
2. Conversion Rate to Opportunity (%)
Because Leads Don’t Pay the Bills
It’s easy to pat yourself on the back when leads pour in.
It’s harder (but smarter) to ask: How many leads actually became real sales opportunities?
Conversion Rate to Opportunity =
(Number of opportunities ÷ number of qualified leads) x 100
If you’re generating 1,000 leads but only 10 opportunities… something’s broken.
Maybe:
-
You’re targeting the wrong audience.
-
Your content isn’t resonating.
-
Your sales handoff process is broken.
Pro Tip: A good benchmark? 15–25% conversion from qualified lead to opportunity in B2B SaaS. If you’re under that, dig into your targeting and messaging.
3. Cost Per Opportunity (CPO)
Quality Over Quantity. Always.
Cost Per Lead (CPL) is a seductive but dangerous metric.
It encourages marketers to optimize for cheap leads, not good ones.
Cost Per Opportunity (CPO) flips that thinking.
Instead of asking, “How cheap can we get leads?”
You ask, “How efficiently can we generate real sales opportunities?”
Pro Tip:
-
CPO = (Total campaign cost ÷ Number of opportunities generated)
-
Compare CPO against Customer Lifetime Value (CLV) to make sure you’re acquiring customers profitably.
If you’re spending $1,000 to generate a $50,000 opportunity? You’re winning—even if your CPL is “high” compared to industry averages.
Why These 3 Metrics Change Everything
When you optimize around Pipeline Generated, Conversion to Opportunity, and Cost Per Opportunity, a few magical things happen:
✅ You align marketing and sales (no more finger-pointing).
✅ You measure what matters to leadership: revenue, not vanity.
✅ You make smarter decisions about where to double down (and where to pull back).
At Kliqwise, this is how we measure success for every demand gen program we run.
No smoke. No mirrors.
Just real results, tied to real revenue.